Exponential Growth of NCBI Genomes
I have been studying bioinformatics for 4 years and had the privilege to work in a sequencing lab and personally see the technology change and accelerate. When I started work at the CGB in 2010, a whole genome cost around $10,000 to sequence on an Illumina GA II machine. In 2013, the IU Bioinformatics Club resequenced a human genome for $4,000. Now Google’s Calico is pushing for the $1,000 human genome. This price point make whole genome resequencing more affordable than the average trip to the hospital, making personalized medicine very attractive.
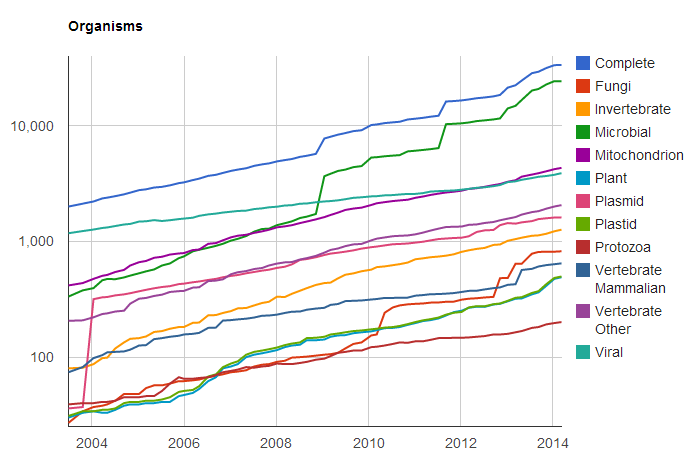
In light of the current affordability of whole-genome sequencing, I wanted to know exactly how many genomes were currently sequenced and completed in NCBI’s databases. I first looked around their RefSeq page and found their growth statistics figures. The data showed an exponential growth of records and actual nucleotides plotted on a logarithmic scale as seen below. The only problem was that RefSeq contains many many sequences besides genomes, and it was not possible to make that differentiation in the figure nor in the data driving the figure.
I continued my search to NCBI’s genome section, but they didn’t have nice statistics comparable to RefSeq. The virus genome page had a “statistics” page containg a table of genome projects in various states of completion, but the plant genome page did not. Since the custom resource pages did not have anything useful, I decided to look around the ftp site.
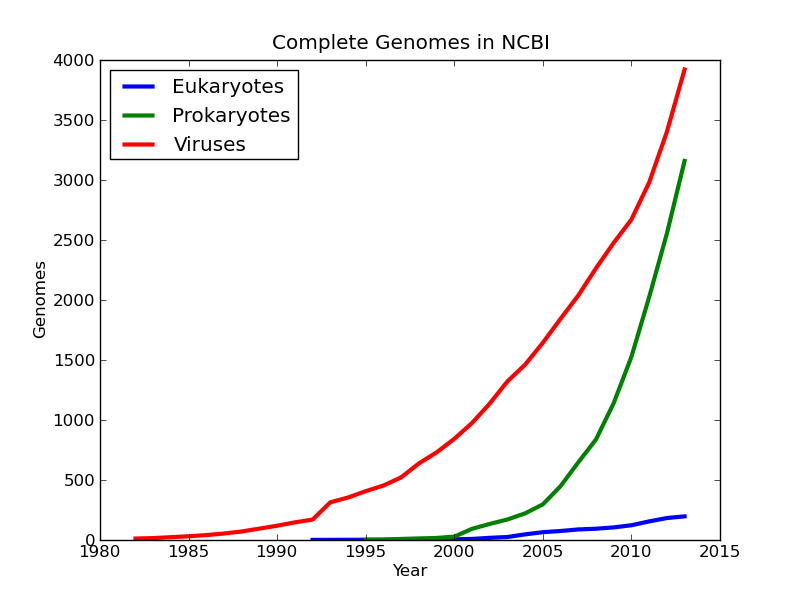
At last I found useful data in the form of three text files in the GENOME_REPORTS folder. Each of the three files (eukaryote, prokaryote, and virus) contained data on all genome projects including their completion status and date of completion. The files were also recently modified, which meant they were regularly updated. Each file had a different column format, so I had to write a separate parsing scheme for each file to filter out all uncompleted genomes. Being left with only completed projects, stored each completion year and a large array and used NumPy’s bincount function to sort and count the occurrences each year. Using Matplotlib, I plotted the cumulative sum of the bin counts by year to show a progression.
Now that I had the parsing and plotting finished, I wanted to change my script to automatically download the data files from NCBI each time it was run so the data was always accurate. I initially tried this using urllib2, but the transfer was always being cut short because no “keep-alive” function was built in to the transfer. A quick search on the internet pointed me to the httplib package, which worked flawlessly. I originally had a threaded download queue when using urllib2, but removed that while debugging the connection interruption. Luckily there are only three files, so there is not a large effect on the overall execution time. My final code with documentation can be found at ncbi_genomes. Leave a pull request or some comments.
31 Mar 2014