Genome Browsers
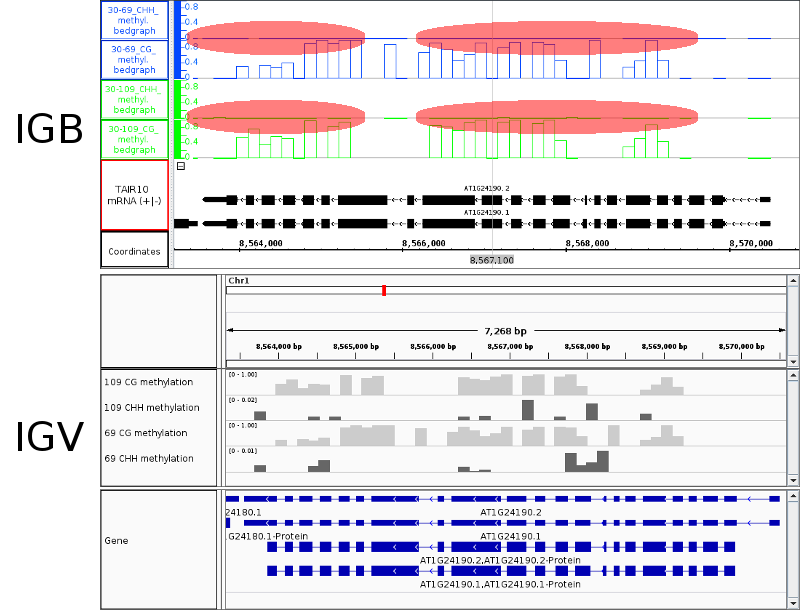
For the past few years, I’ve used IGB as my preferred coverage viewer. I appreciated that it was an open-source project, and I could recommend colleagues to use it since it was an open-source project and it was easy enough to launch a java program on any system. Recently, I switched to IGV since the auto-scaling and data transformation features in IGB were not functioning on bedgraph data. As highlighted by the red circles in the figure, low values are hidden in IGB since the y-axis of the data track does not rescale based upon the viewing window.
While IGV does require registration for usage tracking, it is distributed as open-source software. IGV also comes with a program called igvtools, to convert common data formats to its native tiled data format (TDF) for efficient loading and manipulation. Because IGB does not have a native data format for reading, importing, scanning, and zooming actions always require more time than in IGV. While IGV is not as flashy as IGB, the experience is much more stable and all features seem to work.
To generate figures from IGV, I wrote a python script that creates a batch file to export views from regions in a gff file. The only problem I ran into was that IGV does not produce true SVG images, just a raster embeded in an SVG container. I’ll post that script for public use in a later update.
23 Jan 2014